Quantcast
Channel: Planet Sage
Viewing all 414 articles
Browse latest View live

Vince Knight: Picking a good Vainglory jungler with game theory and sagemath

$
0
0

I’ve recently been playing a really cool video game: Vainglory. This is described as a MOBA which I must admit I had never heard off until this year when my students mentioned it to me, but basically it’s an online multi player game in which players form two teams of 6 heroes and fight each other. The choice of the heroes is very important as the composition of a team can make or break a match. This seems to have a bit of a cult following (so no doubt just like for my post about clash of clans I might annoy people again) and there is a great wiki that gives guides for the play of each player. In this post I’ll describe using Python to scrape that wiki to get data that feeds in to a game theoretic model which I then analyse using Sagemath to give some insight about the choice of hero.

Here’s the map where this all takes place:

Map

So first of all, my understanding is that there are generally three types of playing strategy in the game:

  • Lane: a hero that occupies and tries to take over the main route between the two bases.
  • Jungle: a hero that goes ‘off road’ and kills monsters, gets gold etc…
  • Roam: a hero who roams in between the two and whose main job is to support the other two players.

My personal strategy is to pick a roamer/protector: Ardan (pic below),

Ardan

I generally help out the jungler in my team and try my best to not be a liability by dying.

The wiki has a bunch of information for players. If you google something like ‘vainglory best strategy’ it comes up. If you look up each hero you get a collection of guides ranked by votes each with all sorts of information which includes the where each and every other hero sits on a threat level (from 1 to 10). Here is the threat meter for Ardan from the top guide:

Threat for Ardan
(2015-09-05)

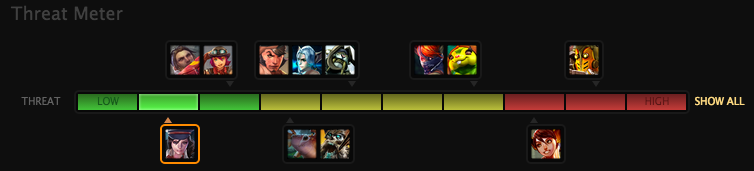
So from that guide it looks like if your opponent is going to be isolated with Ardan then you should pick HERO. In some guides the threat meter does not list all the heros. This is particularly important as it’s these threat meters that I’ve used as a source of data for how good a given hero is against other heros.

This is where the keener player/reader will note that the threat meter only describes the threat to a single player and not any information about how this fits within a team dynamic. This is an important admission on my part: as indicated by the title of this post aims to use data and game theory to give an indication as to how to choose heros for isolated combat against other single heros. So one application of this is choosing a jungler/laner when you expect to go up against another team that is playing a single jungler/laner.

Scraping the data

First things first: I used Python with the BeautifulSoup and requests library. For example here is how I got the lists of all the heroes (and the url to their own respective page on the wiki):

>>>page=requests.get('http://www.vaingloryfire.com/vainglory/wiki/heroes')>>>soup=BeautifulSoup(page.text,'html.parser')>>>root='/vainglory/wiki/heroes'>>>urls=[link.get('href')forlinkinsoup.find_all('a')]>>>heroes={url[len(root)+1:]:urlforurlinurls[2:]ifurl.startswith(root+'/')}>>>delheroes['skye']# Removing skye as she is brand new{u'adagio':u'/vainglory/wiki/heroes/adagio',u'ardan':u'/vainglory/wiki/heroes/ardan',u'catherine':u'/vainglory/wiki/heroes/catherine',u'celeste':u'/vainglory/wiki/heroes/celeste',u'fortress':u'/vainglory/wiki/heroes/fortress',u'glaive':u'/vainglory/wiki/heroes/glaive',u'joule':u'/vainglory/wiki/heroes/joule',u'koshka':u'/vainglory/wiki/heroes/koshka',u'krul':u'/vainglory/wiki/heroes/krul',u'petal':u'/vainglory/wiki/heroes/petal',u'ringo':u'/vainglory/wiki/heroes/ringo',u'rona':u'/vainglory/wiki/heroes/rona',u'saw':u'/vainglory/wiki/heroes/saw',u'skaarf':u'/vainglory/wiki/heroes/skaarf',u'taka':u'/vainglory/wiki/heroes/taka',u'vox':u'/vainglory/wiki/heroes/vox'}

(Note there that I’m removing a brand new hero: Skye as she was released pretty much at the same time as I was writing this post.)

You can see the JuPyTer notebook which shows the code. The main technicality is that I only scraped guides from the front page for each hero. As I’ll describe later, I ran my analysis taking the average threats for a variety of cases: only taking the first guide, only taking the first 2 guides, the first 3 guides etc…

Here for example is the threats data for Adagio if you only look at this first guide:

[0,0,0,0,0,0,4,0,0,0,4,0,0,7,0,0]

Cross referencing that with the order given by the list of heroes above we see that Skaarf ranks a 7 on the threat meter to Adagio, and Ringo and Joule a 4. All the 0s are what I’ve decided to do when a threat meter does not include a given hero: indicating that that hero is not a threat to that hero. I don’t really like this as a solution but it’s probably the least worst way to deal with it (if anyone has a better way of handling this please let me know in the comments).

Here is the threats data for Krul:

[6,3,4,3,6,4,3,7,5,5,4,0,6,6,5,0]

We see that in this case the only heroes that pose no threat to Krul are Fortress and Rona. Thus if your opponent is playing those heroes Krul is a best response.

As will be described in the next section, we need to build up a matrix of these rows which basically shows how well a given hero does against others. Here is the matrix of this when considering the row players and taking the opposite of the threats when using just the top guide:

If you consider a column (that corresponds to a hero) of that matrix, the row player aims to find the row that gives the highest score, which because we’ve taken the opposite of the threat score corresponds to minimising the threat posed by the column hero. This is in essence a risk averse approach, at the very end I’ll comment on what happens to the results when players aim to maximise the threat they pose.

Now that I’ve described the data (you can find all the data written to specific csv files here) I’ll go on to talk about the game theory used to try and see what the equilibrium choice of strategies should/could be.

Game theoretic analysis

All of this has been done using Sagemath, a great open source mathematics package that offers an alternative to Maple, Mathematica etc…

If you’re not familiar with game theory, this video might help (it shows the basics of game theory and how Sagemath can be used to find Nash equilibria):

Before talking about equilibria let’s just look at best response dynamics.

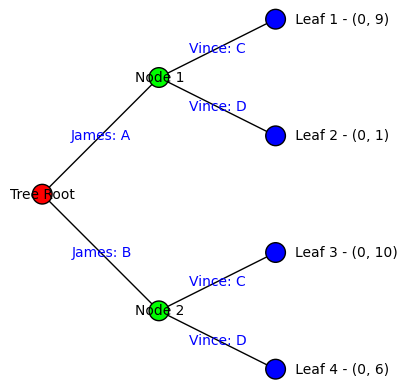
Using Sage we can first of all build up the normal form game for a given number of guides:

sage:defbuild_game(row_player_file,col_player_file):....:"""Import the bi matrices and create the game object"""....:bi_matrices=[]....:forflein[row_player_file,col_player_file]:....:f=open(fle,'r')....:csvrdr=csv.reader(f)....:bi_matrices.append(-matrix([[float(ele)foreleinrow]forrowincsvrdr]))....:f.close()....:....:returnNormalFormGame(bi_matrices)sage:g=build_game("A-01.csv","B-01.csv")

Using this and the best_response method on Sagemath NormalFormGames we can build up all the best responses (according to a given number of guides) go each 
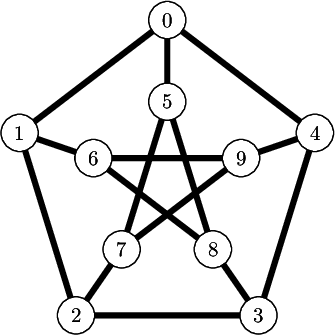
player. The cool thing is that Sagemath has some awesome graph theory written in there so we can transform that in to a nice picture (again: all the code for this can be found here):

best response graph for 1st guide

That plot confirms what we have seen earlier, we see that Krul is a best response to Fortress or Rona. Sadly, because there are so many zeros when just using the first guide, there are a bunch of heros that are not considered a threat to any of the players so they have multiple best responses and our graph is messy.

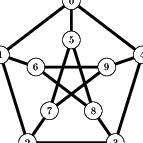
Here is the best response graph when taking the mean threats over all front page guides:

best response graph for all guides

Note that Game Theory assumes that everyone know that everyone know that everyone knows… all this. So for example if two players both player Adagio we are at an equilibrium. However if one player plays Saw then the graph indicates that the opponent should play Koshka, which means that the first player should then deviate and play Fortress which is then also an equilibrium (bot players are playing best responses to each other).

From here on I will continue the analysis using the average utility from all the guides (I’ll come back to this at the end).

So we can use Sagemath to compute all the equilibria for us. A Nash equilibria need not be a pure strategy and so will at times be a probability vector indicating how players should randomly pick a hero. Here for example is the 4th equilibrium computed by Sagemath:

sage:g.obtain_nash(algorithm='lrs')[3][(0,0,0,0,0,0,0,0,3947/17781,0,3194/17781,0,8795/17781,0,0,615/5927),(0,0,0,0,0,0,0,0,3947/17781,0,3194/17781,0,8795/17781,0,0,615/5927)]

This particular equilibria has both players playing a mix of: Fortress, Glaive, Petal and Koshka.

Here is the mean probability distribution for both players, while the particular values should be ignored what is of interest is the heroes that are not played at all. In essence these heroes, accross all the equilibria are not deemed playable:

ne graph for all
guides

We see that this confirms how the previous graph was colored showing the heroes that should be played in blue.

Note that the number of guides and the reliability of all this has a huge effect of the conclusions made. Here are two gifs that show the effect of the number of guides used:

best response dynamics animation

ne graph animation

and here is a plot of the number of equilibria for each guide:

number of equilibria

Up until now all the results are for when players aim to minimise the threat posed to them. In the next section I’ll invert that (python wise it’s a minor swapping around of some inputs) and consider the situation where you want to pick a hero that is aims to be the most threatening.

Seeking to be a threat

First of all here is the best response graph:

best response graph for all
guides

Here is the average of the NE:

best response graph for all
guides

Those 3 players have certainly been able to rip through me on more than one occasion…

Finally here are the Nash equilibria for when a threatening player (plotted in black) is playing against a threat averse player (plotted in grey):

best response graph for all
guides

Conclusion

The main thing that needs to be highlighted before concluding is that this analysis has two weaknesses:

  • The data: what comes out of mathematical models is only as good as what goes in. Scraping the wiki data is a cool thing to do (from a Python point of view) but I’m blindly grabbing guides that might have poor information/opinions in them. This is worth remembering. If someone where to come up with their own threat/performance measures then this work could just be used on that. Ultimately the data available here is better than no data.
  • I am not taking in to account team dynamics. I’m just looking at perceived threats from one hero to another. There are mathematical approaches that could be used to find the best combination of teams and I might get to that in other post one day. Nonetheless this has been a fun application of game theory and still has value I believe.

So to conclude, basing things on the data available to me, I’d suggest that (when both players are acting in a risk averse way) the choice of heros for an isolated job like jungling and/or laneing is in fact reduced to a set from:

If you and your opponent aim to be threatening, the choice is from:

Finally if you aim to be threatening, playing against a player aiming to be risk averse the choice is from:

and vice versa:

(Interestingly for this last type of game there were in general just 1 equilibrium.)

Based on all of this, I would suggest (looking across all of that summary) that (disclaimer: based on the wiki threat data) the bestVainglory hero is Glaive. Again though, this does not take in to account any of the very important team dynamics. I plan to keep on being a protector with Ardan and just doing my best to stay alive…

Another point is that this shows that vainglory is perhaps not immediately balanced. A perfectly balanced game (like Rock Paper Scissor for example) has a Nash Equilibria that evenly plays all strategies:

sage:g=game_theory.normal_form_games.RPS()sage:g.obtain_nash()[[(1/3,1/3,1/3),(1/3,1/3,1/3)]]

Please do take a look at all the code/data at this repository.

This was a fun application of mathematical modelling, I also learnt how to scrape with BeautifulSoup but I mainly look forward to using this in my game theory class this year. I might even suggest we spend 25 minutes of one class having a game on the big screen assuming there are 5 players of Vainglory in my class.


William Stein: The Simons Foundation and Open Source Software

$
0
0

Jim Simons

Jim Simons is a mathematician who left academia to start a hedge fund that beat the stock market. He contributes back to the mathematical community through the Simons Foundation, which provides an enormous amount of support to mathematicians and physicists, and has many outreach programs.

SageMath is a large software package for mathematics that I started in 2005 with the goal of creating a free open source viable alternative to Magma, Mathematica, Maple, and Matlab. People frequently tell me I should approach the Simons Foundation for funding to support Sage. For example:
Jim Simons, after retiring from Renaissance Technologies with a cool 15 billion, has spent the last 10 years giving grants to people in the pure sciences. He's a true academic at heart [...] Anyways, he's very fond of academics and gives MacArthur-esque grants, especially to people who want to change the way mathematics is taught. Approach his fund. I'm 100% sure he'll give you a grant on the spot.

The National Science Foundation

Last month the http://sagemath.org website had 45,114 monthly active users. However, as far as I know, there is no NSF funding for Sage in the United States right now, and development is mostly done on a shoestring in spare time. We have recently failed to get several NSF grants for Sage, despite there being Sage-related grants in the past from NSF. I know that funding is random, and I will keep trying. I have two proposals for Sage funding submitted to NSF right now.

Several million dollars per year

I was incredibly excited in 2012 when David Eisenbud invited me to a meeting at the Simons Foundation headquarters in New York City with the following official description of their goals:
The purpose of this round table is to investigate what sorts of support would facilitate the development, deployment and maintenance of open-source software used for fundamental research in mathematics, statistics and theoretical physics. We hope that this group will consider what support is currently available, and whether there are projects that the Simons Foundation could undertake that would add significantly to the usefulness of computational tools for basic research. Modes of support that duplicate or marginally improve on support that is already available through the universities or the federal government will not be of interest to the foundation. Questions of software that is primarily educational in nature may be useful as a comparison, but are not of primary interest.  The scale of foundation support will depend upon what is needed and on the potential scientific benefit, but could be substantial, perhaps up to several million dollars per year.
Current modes of funding for research software in mathematics, statistics and physics differ very significantly. There may be correspondingly great differences in what the foundation might accomplish in these areas. We hope that the round table members will be able to help the foundation understand the current landscape  (what are the needs, what is available, whether it is useful, how it is supported) both in general and across the different disciplines, and will help us think creatively about new possibilities.
I flew across country to this the meeting, where we spent the day discussing ways in which "several million dollars per year" could revolutionize "the development, deployment and maintenance of open-source software used for fundamental research in mathematics...".

In the afternoon Jim Simons arrived, and shook our hands. He then lectured us with some anecdotes, didn't listen to what we had to say, and didn't seem to understand open source software. I was frustrated watching how he treated the other participants, so I didn't say a word to him. I feel bad for failing to express myself.

The Decision

In the backroom during a coffee break, David Eisenbud told me that it had already been decided that they were going to just fund Magma by making it freely available to all academics in North America. WTF? I explained to David that Magma is closed source and that not only does funding Magma not help open source software like Sage, it actively hurts it. A huge motivation for people to contribute to Sage is that they do not have access to Magma (which was very expensive).

I wandered out of that meeting in a daze; things had gone so differently than I had expected. How could a goal to "facilitate the development, deployment and maintenance of open-source software... perhaps up to several million dollars per year" result in a decision that would make things possibly much worse for open source software?

That day I started thinking about creating what would become SageMathCloud. The engineering work needed to make Sage accessible to a wider audience wasn't going to happen without substantial funding (I had put years of my life into this problem but it's really hard, and I couldn't do it by myself). At least I could try to make it so people don't have to install Sage (which is very difficult). I also hoped a commercial entity could provide a more sustainable source of funding for open source mathematics software. Three years later, the net result of me starting SageMathCloud and spending almost every waking moment on it is that I've gone from having many grants to not, and SageMathCloud itself is losing money. But I remain cautiously optimistic and forge on...

We will not fund Sage

Prompted by numerous messages recently from people, I wrote to David Eisenbud this week. He suggested I write to Yuri Schinkel, who is the current director of the Simons Foundation:
Dear William,
Before I joined the foundation, there was a meeting conducted by David Eisenbud to discuss possible projects in this area, including Sage.
After that meeting it was decided that the foundation would support Magma.
Please keep me in the loop regarding developments at Sage, but I regret that we will not fund Sage at this time.
Best regards, Yuri
The Simons Foundation, the NSF, or any other foundation does not owe the Sage project anything. Sage is used by a lot of people for free, who together have their research and teaching supported by hundreds of millions of dollars in NSF grants. Meanwhile the Sage project barely hobbles along. I meet people who have fantastic development or documentations projects for Sage that they can't do because they are far too busy with their fulltime teaching jobs. More funding would have a massive impact. It's only fair that the US mathematical community is at least aware of a missed opportunity.
Funding in Europe for open source math software is much better.

Hacker News discussion

William Stein

$
0
0

Funding Open Source Mathematical Software in the United States

I do not know how to get funding for open source mathematical software in the United States. However, I'm trying.

Why: Because Sage is Hobbling Along

Despite what we might think in our Sage-developer bubble, Sage is hobbling along, and without an infusion of financial support very soon, I think the project is going to fail in the next few years. I have access to Google analytics data for sagemath.org since 2007, and there has been no growth  in active users of the website since 2011:

Something that is Missing

The worse part of all for me, after ten years, is seeing things like this email today from John Palmieri, where he talks about writing slow but interesting algebraic topology code, and needing help from somebody who knows Cython to actually make his code fast.

I know from my three visits to the Magma group in Sydney that such assistance is precisely what having real financial support can provide. Such money makes it possible to have fulltime people who know the tools and how to optimize them well, and they work on this sort of speedup and integration -- this "devil is in the details" work -- for each major contribution (they are sort of like a highly skilled version of a journal copy editor and referee all in one). Doing this makes a massive difference, but also costs on the order of $1 million / year to have any real impact. 1 million is probably the Magma budget to support around 10 people and periodic visitors, and of course like 1% of the budget of Matlab/Mathematica. Magma has this support partly because Magma is closed source, and maintains tight control on who may use it.

Searching for a Funding Model

Sage is open source and freely available to all, so it is of potential huge value to the community by being owned by everybody and changeable. However, those who fund Magma (either directly or indirectly) haven't funded Sage at the same level for some reason. I can't make Sage closed source and copy that very successful funding model. I've tried everything I can think of given the time and resources I have, and the only model left that seems able to support open source is having a company that does something else well and makes money, then using some of the profit to fund open source (Intel is the biggest contributor to Linux).

SageMath, Inc.

Since I failed to find any companies that passionately care about Sage like Intel/Google/RedHat/etc. care about Linux, I started one. I've been working on SageMathCloud extremely hard for over 3 years now, with the hopes that at least it could be a way to fund Sage development.

Vince Knight: A Summer of game theory software development

$
0
0

This Summer has seen 3 undergraduates carry out 8 week placements with me developing further game theoretic code in Sagemath:

Hannah Lorrimore (going in to her 2nd year) spent her placement working very hard to implement classes for extensive form games. These are mainly a graphical representation of games based on a tree like structure. Hannah not only developed the appropriate data structures but also worked hard to make sure the graphics looked good. You can see an example of the output below:

James Campbell (going in to an industrial placement year) picked up where he left off last Summer (James built the first parts of Game Theory code for Sagemath) and developed a test for degeneracy of games. This involves building a corresponding linear system for the game and testing a particular condition. James and I wrote a blog post about some of the theory here: http://vknight.org/unpeudemath/code/2015/06/25/on_testing_degeneracy_of_games/.

Rhys Ward (going in to his first year) has been working at the interface between extensive form games and normal form games. His main contribution (Rhys is still working as of the writing of this) has been to build code that converts an extensive form game to a normal form game. This requires carefully traversing the underlying tree and keeping track of the strategy space. Rhys has also built a catalog of normal form games and is now starting to work on the capability to remove dominated strategies from a normal form game.

Hannah, Rhys and James have also been working in conjunction with Tobenna Peter Igwe who is a PhD student at the University of Liverpool. Tobenna has been implementing a variety of game theoretic code as part of the Google Summer of Code project with me as his mentor.

Hannah, James, Tobenna and I visited Oxford University to spend two days working with Dr Dima Pasechnik and giving a talk. You can see a video of the talk here: https://www.youtube.com/watch?v=v4kKYr5I2io

All of this code will now be reviewed by the Sagemath community and will (just as James’s code last year) be eventually available to anyone who wants to study game theory.

Note: this blog post is based on a similar Cardiff University newsletter item.

Sébastien Labbé: There are 13.366.431.646 solutions to the Quantumino game

$
0
0

Some years ago, I wrote code in Sage to solve the Quantumino puzzle. I also used it to make a one-minute video illustrating the Dancing links algorithm which I am proud to say it is now part of the Dancing links wikipedia page.

/Files/2015/Quantumino.png

I must say that the video is not perfect. On wikipedia, the file talk page of the video says that the Jerky camera movement is distracting. That is because I managed to make the video out of images created by .show(viewer='tachyon') which changes the coordinate system, hardcodes a lot of parameters, zoom properly, simplifies stuff to make sure the user don't see just a blank image. But, for making a movie, we need access to more parameters especially the placement of the camera (to avoid the jerky movement). I know that Tachyon allows all of that. It is still a project that I have to create a more versatile Graphics3D -> Tachyon conversion allowing to construct nice videos of evolving mathematical objects. That's another story.

Let me recall that the goal of the Quantumino puzzle is to fill a \(2\times 5\times 8\) box with 16 out of 17 three-dimensional pentaminos. After writing the sage code to solve the puzzle, one question was left: how many solutions are there? Is the official website realist or very prudent when they say that there are over 10.000 potential solutions? Can it be computed in hours? days? months? years? ... or light-years!? The only thing I knew was that the following computation (letting the 0-th pentamino aside) never finished on my machine:

sage:fromsage.games.quantuminoimportQuantuminoSolversage:QuantuminoSolver(0).number_of_solutions()

Since I spent already too much time on this side-project, I decided in 2012 to stop spending any more time on it and to really focus on finishing writing my thesis.

So before I finish writing my thesis, I knew that the computation was not going to take a light-year, since I was able to finish the computation of the number of solutions when the 0-th pentamino is put aside and when the 1-st pentamino is pre-positioned somewhere in the box. That computation completed in 4 hours on my old laptop and gave about 5 millions solutions. There are 17 choices of pentatminos to put aside, there are 360 distinct positions of the 1-st pentamino, so I estimated the number of solution to be something like \(17\times 360\times 5000000 = 30 \times 10^9\). Most importantly, I estimated the computation to take \(17\times 360\times 4= 24480\) hours or 1020 days. Therefore, I knew I could not do it on my laptop.

But last year, I received an email from the designer of the Quantumino puzzle:

-------- Message transféré --------
Sujet : quantumino
Date : Tue, 09 Dec 2014 13:22:30 +0100
De : Nicolaas Neuwahl
Pour : Sebastien Labbe

hi sébastien labbé,

i'm the designer of the quantumino puzzle.
i'm not a mathematician, i'm an architect. i like mathematics.
i'm quite impressed to see the sage work on quantumino, also i have not the
knowledge for full understanding.

i have a question for you - can you tell me HOW MANY different quantumino-
solutions exist?

ty and bye

nicolaas neuwahl

This summer was a good timing to launch the computation on my beautiful Intel® Core™ i5-4590 CPU @ 3.30GHz × 4 at Université de Liège. First, I improved the Sage code to allow a parallel computation of number of solutions in the dancing links code (#18987, merged in a Sage 6.9.beta6). Secondly, we may remark that each tiling of the \(2\times 5\times 8\) box can be rotated in order to find 3 other solutions. It is possible to gain a factor 4 by avoiding to count 4 times the same solution up to rotations (#19107, still needs work from myself). Thanks to Vincent Delecroix for doing the review on both ticket.

With those two tickets (some previous version to be honest) on top of sage-6.8, I started the computation on August 4th and the computation finished last week on September 18th for a total of 45 days. The computation was stopped only once on September 8th (I forgot to close firefox and thunderbird that night...).

The number of solutions and computation time for each pentamino put aside together with the first solution found is shown in the table below. We remark that some values are equal when the aside pentaminoes are miror images (why!?:).

/Files/2015/b0.png/Files/2015/b1.png
634900493 solutions634900493 solutions
2 days, 6:22:44.8833582 days, 6:19:08.945691
/Files/2015/b2.png/Files/2015/b3.png
509560697 solutions509560697 solutions
2 days, 0:01:36.8446122 days, 0:41:59.447773
/Files/2015/b4.png/Files/2015/b5.png
628384422 solutions628384422 solutions
2 days, 7:52:31.4592472 days, 8:44:49.465672
/Files/2015/b6.png/Files/2015/b7.png
1212362145 solutions1212362145 solutions
3 days, 17:25:00.3466273 days, 19:10:02.353063
/Files/2015/b8.png/Files/2015/b9.png
197325298 solutions556534800 solutions
22:51:54.4399321 day, 19:05:23.908326
/Files/2015/b10.png/Files/2015/b11.png
664820756 solutions468206736 solutions
2 days, 8:48:54.7676621 day, 20:14:56.014557
/Files/2015/b12.png/Files/2015/b13.png
1385955043 solutions1385955043 solutions
4 days, 1:40:30.2709294 days, 4:44:05.399367
/Files/2015/b14.png/Files/2015/b15.png
694998374 solutions694998374 solutions
2 days, 11:44:29.6312 days, 6:01:57.946708
/Files/2015/b16.png 
1347221708 solutions 
3 days, 21:51:29.043459 

Therefore the total number of solutions up to rotations is \(13 366 431 646 \approx 13\times 10^9\) which is indeed more than 10000:)

sage:L=[634900493,634900493,509560697,509560697,628384422,628384422,1212362145,1212362145,197325298,556534800,664820756,468206736,1385955043,1385955043,694998374,694998374,1347221708]sage:sum(L)13366431646sage:factor(_)2*23*271*1072231
Summary
The machine (4 cores)Intel® Core™ i5-4590 CPU @ 3.30GHz × 4 (Université de Liège)
Computation Time45 days, (Aug 4th -- Sep 18th, 2015)
Number of solutions (up to rotations)13.366.431.646
Number of solutions / cpu / s859.47

My code will be available on github.

William Stein: SageMathCloud's poor user retention rate

$
0
0

Poor retention rate

Many people try SageMathCloud, but only a small percentage stick around.  I definitely don't know why. Recent SageMathCloud rates are below 4%:


Is it performance?

Question: Are the people who try SMC discouraged by performance issues?

I think it's unlikely many users are leaving due to hitting noticeable performance issues.  I think I would know, since there's a huge bold messages all over the site that say "Email help@sagemath.com: in case of problems, do not hesitate to immediately email us. We want to know if anything is broken!"    In the past when there have been performance or availability issues -- which of course do happen sometimes due to bugs or whatever -- I quickly get a lot of emails.  I haven't got anything that mentioned performance recently.  And usage of SMC is at an all time high: in the last day there were 676 projects created and 3500 projects modified -- which is significantly higher than ever before since the site started.  It's also about 2.2x what we had exactly a year ago.    


Is it the user interface?

Question: Is the SMC user interface highly discouraging and difficult to use?

My current best guess is that the main reason for attrition of our users is that 
they do not understand how to actually use SageMathCloud (SMC), and the interface doesn't help at all.   I think a large number of users get massively confused and lost when trying to use SMC.    It's pretty obvious this happens if you just watch what they do...    In order to have a foundation on which to fix that, the plan I came up with in May was to at least fix the frontend implementation so that it would be  much easier to do development with -- by switching from a confusing  mess of jQuery soup, e.g., 2012-style single page app development -- to Facebook's new React.js approach.  This is basically half done and deployed, and I'm going to work very hard for a while to finish it.   Once it's done, it's going to be much easier to improve the UI to  make it more user friendly.

Is it the open source software?

Question: Is open source mathematical software not sufficiently user friendly?

Fixing the UI probably won't help so much with improving the underlying open 
source mathematical software to be friendly though.    This is a massive, deep, and very difficult problem, and might be why growth of Sage stopped in 2011:


SageMath (and maybe Numpy/Scipy/IPython/etc.) are not as user friendly as Mathematica/Matlab.   I think they could be even more user friendly, but it's highly unlikely as long as the developers are mostly working on SageMath in their spare time as part of advanced research projects (which have little to do with user friendliness).  

Analyzing data about mistakes, frustation, and issues people actually have with  real worksheets and notebooks could also help a lot with directing our  effort in improving Sage/Python/Numpy/etc to be more user friendly.


Is it support?

Question: Are users frustrated by lack of interactive support?

Having integrated high-quality support for users inside SMC, in which we help 
them write code, answer questions, etc., could help with retention.  


Why don't you use SageMathCloud?

I've been watching this  stuff closely for over a decade most waking moments, and everybody likes to complain to me.    Why don't you use SageMathCloud?   Tell me:  wstein@sagemath.com.

William Stein: What is SageMath's strategy?

$
0
0
Here is SageMath's strategy, or at least what my strategy toward SageMath has been for the last 5 years.

Diagnose the problem

Statement of problem: SageMath is not growing.

Justification

Facts: Growth in the number of active users [1] of SageMath has stalled since about 2011 (as defined by Google analytics on sagemath.org). From 2008 to 2011, year-on-year growth was about 50%, which isn't great. However, from 2011 to now, year-on-year growth is slightly less than 0%. It was maybe -10% from 2013 to 2014. Incidentally, number of monthly active users of sagemath.org is about 68,652 right now, but the raw number isn't as import as the year-to-year rate of change.

I set an overall mission statement for the Sage project at the outset, which was is to be a viable alternative to Magma, Maple, Mathematica and Matlab. Being a "viable alternative" is something that holds or doesn't for specific people. A useful measure of this mission then is whether or not people use Sage. This is a different metric than trying to argue from "first principles" by making a list of features of each system, comparing benchmarks, etc.


Guiding policies

Statement of policy: focus on undergraduate students in STEM courses (science, tech, engineering, math)

Justification

In order for Sage to start growing again, identify groups of people that are not using Sage. Then decide, for each of these groups, who might find value in using Sage, especially if we are able to put work into making it easier for them to benefit from Sage. This is something to re-evaluate periodically. In itself, this is very generic -- it's what any software project that wishes to grow should do. The interesting part is the details.
Some big groups of potential future users of Sage, who use Sage very little now, include
  • employees/engineers in various industries (from defense contractors, to finance, to health care to "data science").
  • researchers in area of mathematics where Sage is currently not popular
  • undergraduate students in STEM courses (science, tech, engineering, math)
I think by far the most promising group is "undergraduate students in STEM courses". In many cases they use no software at all or are unhappy with what they do use. They are extremely cost sensitive. Open source provides a unique advantage in education because it is less expensive than closed source software, and having access to source code is something that instructors consider valuable as part of the learning experience. Also, state of the art performance, which often requires enormous dedicated for-pay work, is frequently not a requirement.

Actions

  • (a) Make access to Sage as easy as possible.
  • (b) Encourage the creation of educational resources (books, tutorials, etc.) that make using Sage for particular courses as easy as possible.
  • (c) Implement missing functionality in Sage that is needed in support of undergraduate teaching.

Justification

Why don't more undergraduates use Sage? For the most part, students use what they are told to use by their instructors. So why don't instructors chose to use Sage? (a) Sage is not trivial to install (in fact it is incredibly hard to install), (b) There are limited resources (books, tutorials, course materials, etc.) for making using Sage really easy, (c) Sage is missing key functionality needed in support undergraduate teaching.

Regarding (c), in 2008 Sage was utterly useless for most STEM courses. However, over the years things changed for the better, due to the hard work of Rob Beezer, Karl Dieter, Burcin Erocal, and many others. Also, for quite a bit of STEM work, the numerical Python ecosystem (and/or R) provides much of what is needed, and both have evolved enormously in recent years. They are all usable from Sage, and making such use easier should be an extremely high priority. Related -- Bill Hart wrote "I recently sat down with some serious developers and we discussed symbolics in Sage (which I know nothing about). They argued that Sage is not a viable contender in that area, and we discussed some of the possible reasons for that. " The reason is that the symbolic functionality in Sage is motivated by making Sage useful for undergraduate teaching; it has nothing to do with what serious developers in symbolics would care about.

Regarding (b), an NSF (called "UTMOST") helped in this direction... Also, Gregory Bard wrote "Sage for undergraduates", which is exactly the sort of thing we should be very strongly encouraging. This is a book that is published by the AMS and is also freely available. And it squarely addresses exactly this audience. Similarly, the French book that Paul Zimmerman edited is fantastic for France. Let's make an order of magnitude similar resources along these lines! Let's make vastly more tutorials and reference manuals that are "for undergraduates".

Regarding (a), in my opinion the most viable option that fits with current trends in software is a full web application that provides access to Sage. SageMathCloud is what I've been doing in this direction, and it's been growing since 2013 at over 100% year on year, and much is in place so that it could scale up to more users. It still has a huge way to go regarding user friendliness, and it is still losing money every month. But it is a concrete action toward which nontrivial effort has been invested, and it has the potential to solve problem (a) for a large number of potential STEM users. College students very often have extremely good bandwidth coupled with cheap weak laptops, so a web application is the natural solution for them.

Though much has been done to make Sage easier to install on individual computers, it's exactly the sort of problem that money could help solve, but for which we have little money. I'm optimistic that OpenDreamKit will do something in this direction.

[I've made this post motivated by the discussion in this thread.  Also, I used the framework from this book.]

Vince Knight: Getting your first lectureship

$
0
0

On Wednesday I was invited to participate in a Webinar entitled “Getting your first lecturship”. This was organised by Cardiff University’s graduate college (UGC). The format included an overview of recent findings from a survey conducted by the Association of Careers Advisory Services and then a discussion including Dr Sophie Coulombeau and Dr Claire Shaw.

You can see the recording below:

Here is the UGC page which includes a pdf with a variety of hopefully useful resources.

Sophie and Claire had some excellent advice and I would really recommend watching the video if you are at a stage of your academic career (PhD, postdoc…) and thinking of getting a lectureship in the United Kingdom (it’s probably useful in other countries also, but we concentrated on particularities of the UK).

Some of the particular points that stayed with me:

  • Self care: it’s very easy to let academia do a lot of damage. This is not something I’m particularly good at myself but stress and mental health is something that you should always keep an eye on: at whatever stage of your career you are.
  • Selling the whole narrative: at interview it’s important to find a way to think about what a particular post is looking for and how/why you fit that particular role.

What was also interesting was that we all seemed to agree that we were lucky. This was certainly the case with me, circumstances were just right and I was very lucky to have leadership that gave me a wealth of opportunities.

On a slightly related note, as I was writing this post, I thought about Tim Hopper’s great resource shouldigetaphd.com/. If you are thinking about doing a PhD at all, perhaps take a look at the awesome case stories there…


Vince Knight: Getting in to reddit

$
0
0

In a previous post I wrote about the podcasts I listen to. I really need to update that as things have changed but this post is not the update. In this post I’ll discuss some of my early thoughts as I get in to reddit.

My first real encounter of reddit was when u/I_feel_shy posted a link to my blogpost about Clash of clans. I create an account to be able to answer some questions on there but never really stayed put.

I think that one of the reasons for this was that I didn’t stumble on a mobile app I liked. This changed when @mkbhd posted a video mentioning that his app of choice was Relay for reddit.

So for about 2 months or so I’ve been using reddit regularly, and I have to admit that it’s become one of the first things I check whenever I get a chance. I think it’s the simplicity of it all that I like.

Here are the subreddits I subscribe to (please do let me know which ones I’m missing):

  • r/android: I use an android phone and this seems to suggest neat apps, and let me know what’s coming up.
  • r/AskAcademic: this has a variety of interesting discussions about Academia, with questions from students and faculty.
  • r/askscience: a nice reddit with interesting questions that pop up, a neat one recently was “why can’t I weigh the earth by putting a scale upside down”.
  • r/dataisbeautiful: cool data related stuff :)
  • r/education: am still undecided as to whether or not I find this a valuable subreddit. I will wait and see…
  • r/GAMETHEORY: not a very busy subbredit but everynow and then something interesting comes up.
  • r/learnpython: I’ve only just joined this one. Hoping I might be able to help with some questions but also see some neat resources etc…
  • r/math: one of the mathematics subreddits.
  • r/mathematics: another one :)
  • r/nottheonion: if you haven’t heard of the onion go take a look and then this subreddit will make a lot of sense…
  • r/Python: I learn a lot from scrolling through this…
  • r/rugbyunion: I like rugby.
  • r/sagemath: this is the subreddit for Sagemath, it’s not terribly active but every now and then something cool pops up.
  • r/science: a general subreddit about science. Interesting things usually pop up here.
  • r/sysor: this is the subreddit for Operational Research (etc…). I’ve pied up and answered a question here but otherwise have learnt a few neat things that have been going on.
  • r/vim: vim is my editor of choice and it’s nice to see things trickle through here. Today I read about the Goyo plugin which I’m actually using whilst writing this post, on there.

I’m pretty sure I’m missing out a bunch of interesting subreddits so please let me know in the comments :)

I’m also still trying to figure out if reddit is a social network or not. The main reason for this is that I’m not sure if it’s cool to post links to my own blog posts on there or not. I’ve done this one or twice but ams still trying to figure out the correct protocol. In the mean time I continue to read, vote and sometimes comment. It’s a nice place (I know reddit does not have this reputation but perhaps I’m just staying in the right places…).

The Matroid Union: Google Summer of Code 2015: outcomes

$
0
0

Guest post by Chao Xu

In the summer, I have extended the SAGE code base for matroids for Google Summer of Code. This post shows a few example of it’s new capabilities.

Connectivity

Let $M$ be a matroid with groundset $E$ and rank function $r$. A partition of the groundset $\{E_1,E_2\}$ is a $m$-separation if $|E_1|,|E_2|\geq m$ and $r(E_1)+r(E_2)-r(E)\leq m-1$. $M$ is called $k$-connected if there is no $m$-separation for any $m k$. The Fano matroid is an example of $3$-connected matroid.

The Fano matroid is not $4$-connected. Using the certificate=True field, we can also output a certificate that verify its not-$4$-connectness. The certificate is a $m$-separation where $m 4$. Since we know Fano matroid is $3$-connected, we know the output should be a $3$-separation.

We also have a method for deciding $k$-connectivity, and returning a certificate.

There are 3 algorithms for $3$-connectivity. One can pass it as a string to the algorithm field of is_3connected.

  1. "bridges": The $3$-connectivity algorithm Bixby and Cunningham. [BC79]
  2. "intersection": the matroid intersection based algorithm
  3. "shifting": the shifting algorithm. [Raj87]

The default algorithm is the bridges based algorithm.

The following is an example to compare the running time of each approach.

The new bridges based algorithm is much faster than the previous algorithm in SAGE.

For $4$-connectivity, we tried to use the shifting approach, which has an running time of $O(n^{4.5}\sqrt{\log n})$, where $n$ is the size of the groundset. The intuitive idea is fixing some elements and tries to grow a separator. In theory, the shifting algorithm should be fast if the graph is not $4$-connected, as we can be lucky and find a separator quickly. In practice, it is still slower than the optimized matroid intersection based algorithm, which have a worst case $O(n^5)$ running time. There might be two reasons: the matroid intersection actually avoids the worst case running time in practice, and the shifting algorithm is not well optimized.

Matroid intersection and union

There is a new implementation of matroid intersection algorithm based on Cunningham’s paper [Cun86]. For people who are familiar with blocking flow algorithms for maximum flows, this is the matroid version. The running time is $O(\sqrt{p}rn)$, where $p$ is the size of the maximum common independent set, $r$ is the rank, and $n$ is the size of the groundset. Here is an example of taking matroid intersection between two randomly generated linear matroids.

Using matroid intersection, we have preliminary support for matroid union and matroid sum. Both construction takes a list of matroids.

The matroid sum operation takes disjoint union of the groundsets. Hence the new ground set will have the first coordinate indicating which matroid it comes from, and second coordinate indicate the element in the matroid.

Here is an example of matroid union of two copies of uniform matroid $U(1,5)$ and $U(2,5)$. The output is isomorphic to $U(4,5)$.

One of the application of matroid union is matroid partitioning, which partitions the groundset of the matroid to minimum number of independent sets. Here is an example that partitions the edges of a graph to minimum number of forests.

Acknowledgements

I would like to thank my mentors Stefan van Zwam and Michael Welsh for helping me with the project. I also like to thank Rudi Pendavingh, who have made various valuable suggestions and implemented many optimizations himself.

References

[BC79] R.E Bixby, W.H Cunningham. Matroids, graphs and 3-connectivity, J.A Bondy, U.S.R Murty (Eds.), Graph Theory and Related Topics, Academic Press, New York (1979), pp. 91-103.

[Raj87] Rajan, A. (1987). Algorithmic applications of connectivity and related topics in matroid theory. Northwestern university.

[Cun86] William H Cunningham. 1986. Improved bounds for matroid partition and intersection algorithms. SIAM J. Comput. 15, 4 (November 1986), 948-957.

Vince Knight: Visualising Markov Chains with NetworkX

$
0
0

I’ve written quite a few blog posts about Markov chains (it occupies a central role in quite a lot of my research). In general I visualise 1 or 2 dimensional chains using Tikz (the LaTeX package) sometimes scripting the drawing of these using Python but in this post I’ll describe how to use the awesome networkx package to represent the chains.

For all of this we’re going to need the following three imports:

from__future__importdivision# Only for how I'm writing the transition matriximportnetworkxasnx# For the magicimportmatplotlib.pyplotasplt# For plotting

Let’s consider the Markov Chain I describe in this post about waiting times in a tandem queue. You can see an image of it (drawn in Tikz) below:

As is described in that post, we’re dealing with a two dimensional chain and without going in to the details, the states are given by:

states=[(0,0),(1,0),(2,0),(3,0),(4,0),(0,1),(1,1),(2,1),(3,1),(4,1),(0,2),(1,2),(2,2),(3,2),(4,2),(0,3),(1,3),(2,3),(3,3),(0,4),(1,4),(2,4)]

and the transition matrix \(Q\) by:

Q=[[-5,5,0,0,0,0,0,0,0,0,0,0,0,0,0,0,0,0,0,0,0,0],[1/2,-6,5,0,0,1/2,0,0,0,0,0,0,0,0,0,0,0,0,0,0,0,0],[0,1,-7,5,0,0,1,0,0,0,0,0,0,0,0,0,0,0,0,0,0,0],[0,0,1,-7,5,0,0,1,0,0,0,0,0,0,0,0,0,0,0,0,0,0],[0,0,0,1,-2,0,0,0,1,0,0,0,0,0,0,0,0,0,0,0,0,0],[1/5,0,0,0,0,-26/5,5,0,0,0,0,0,0,0,0,0,0,0,0,0,0,0],[0,1/5,0,0,0,1/2,-31/5,5,0,0,1/2,0,0,0,0,0,0,0,0,0,0,0],[0,0,1/5,0,0,0,1,-36/5,5,0,0,1,0,0,0,0,0,0,0,0,0,0],[0,0,0,1/5,0,0,0,1,-36/5,5,0,0,1,0,0,0,0,0,0,0,0,0],[0,0,0,0,1/5,0,0,0,1,-11/5,0,0,0,1,0,0,0,0,0,0,0,0],[0,0,0,0,0,2/5,0,0,0,0,-27/5,5,0,0,0,0,0,0,0,0,0,0],[0,0,0,0,0,0,2/5,0,0,0,1/2,-32/5,5,0,0,1/2,0,0,0,0,0,0],[0,0,0,0,0,0,0,2/5,0,0,0,1,-37/5,5,0,0,1,0,0,0,0,0],[0,0,0,0,0,0,0,0,2/5,0,0,0,1,-37/5,5,0,0,1,0,0,0,0],[0,0,0,0,0,0,0,0,0,2/5,0,0,0,1,-12/5,0,0,0,1,0,0,0],[0,0,0,0,0,0,0,0,0,0,2/5,0,0,0,0,-27/5,5,0,0,0,0,0],[0,0,0,0,0,0,0,0,0,0,0,2/5,0,0,0,1/2,-32/5,5,0,1/2,0,0],[0,0,0,0,0,0,0,0,0,0,0,0,2/5,0,0,0,1/2,-32/5,5,0,1/2,0],[0,0,0,0,0,0,0,0,0,0,0,0,0,2/5,0,0,0,1/2,-7/5,0,0,1/2],[0,0,0,0,0,0,0,0,0,0,0,0,0,0,0,2/5,0,0,0,-27/5,5,0],[0,0,0,0,0,0,0,0,0,0,0,0,0,0,0,0,2/5,0,0,0,-27/5,5],[0,0,0,0,0,0,0,0,0,0,0,0,0,0,0,0,0,2/5,0,0,0,-2/5]]

To build the networkx graph we will use our states as nodes and have edges labeled by the corresponding values of \(Q\) (ignoring edges that would correspond to a value of 0). The neat thing about networkx is that it allows you to have any Python instance as a node:

G=nx.MultiDiGraph()labels={}edge_labels={}fori,origin_stateinenumerate(states):forj,destination_stateinenumerate(states):rate=Q[i][j]ifrate>0:G.add_edge(origin_state,destination_state,weight=rate,label="{:.02f}".format(rate))edge_labels[(origin_state,destination_state)]=label="{:.02f}".format(rate)

Now we can draw the chain:

plt.figure(figsize=(14,7))node_size=200pos={state:list(state)forstateinstates}nx.draw_networkx_edges(G,pos,width=1.0,alpha=0.5)nx.draw_networkx_labels(G,pos,font_weight=2)nx.draw_networkx_edge_labels(G,pos,edge_labels)plt.axis('off');

You can see the result here:

As you can see in the networkx documentatin:

Yes, it is ugly but drawing proper arrows with Matplotlib this way is tricky.

So instead I’m going to write this to a .dot file:

nx.write_dot(G,'mc.dot')

Once we’ve done that we have a standard network file format, so we can use the command line to convert that to whatever format we want, here I’m creating the png file below:

$ neato -Tps -Goverlap=scale mc.dot -o mc.ps; convert mc.ps mc.png

The .dot file is a standard graph format but you can also just open up the .ps file in whatever you want and modify the image. Here it is in inkscape:

Even if the above is not as immediately esthetically pleasing as a nice Tikz diagram (but how could it be?) it’s a nice quick and easy way to visualise a Markov chain as you’re working on it.

Here is a JuPyTer notebook with all the above code.

Harald Schilly: Sage Days 70 - Berkeley - November 2015

William Stein: "Prime Numbers and the Riemann Hypothesis", Cambridge University Press, and SageMathCloud

$
0
0

Overview

Barry Mazur and I spent over a decade writing a popular math book "Prime Numbers and the Riemann Hypothesis", which will be published by Cambridge Univeristy Press in 2016.  The book involves a large number of illustrations created using SageMath, and was mostly written using the LaTeX editor in SageMathCloud.

This post is meant to provide a glimpse into the writing process and also content of the book.

This is about making research math a little more accessible, about math education, and about technology.

Intended Audience: Research mathematicians! Though there is no mathematics at all in this post.

The book is here: http://wstein.org/rh/
Download a copy before we have to remove it from the web!

Goal: The goal of our book is simply to explain what the Riemann Hypothesis is really about. It is a book about mathematics by two mathematicians. The mathematics is front and center; we barely touch on people, history, or culture, since there are already numerous books that address the non-mathematical aspects of RH.  Our target audience is math-loving high school students, retired electrical engineers, and you.

Clay Mathematics Institute Lectures: 2005

The book started in May 2005 when the Clay Math Institute asked Barry Mazur to give a large lecture to a popular audience at MIT and he chose to talk about RH, with me helping with preparations. His talk was entitled "Are there still unsolved problems about the numbers 1, 2, 3, 4, ... ?"

See http://www.claymath.org/library/public_lectures/mazur_riemann_hypothesis.pdf

Barry Mazur receiving a prize:


Barry's talk went well, and we decided to try to expand on it in the form of a book. We had a long summer working session in a vacation house near an Atlantic beach, in which we greatly refined our presentation. (I remember that I also finally switched from Linux to OS X on my laptop when Ubuntu made a huge mistake pushing out a standard update that hosed X11 for everybody in the world.)

Classical Fourier Transform

Going beyond the original Clay Lecture, I kept pushing Barry to see if he could describe RH as much as possible in terms of the classical Fourier transform applied to a function that could be derived via a very simple process from the prime counting function pi(x). Of course, he could. This led to more questions than it answered, and interesting numerical observations that are more precise than analytic number theorists typically consider.

Our approach to writing the book was to try to reverse engineer how Riemann might have been inspired to come up with RH in the first place, given how Fourier analysis of periodic functions was in the air. This led us to some surprisingly subtle mathematical questions, some of which we plan to investigate in research papers. They also indirectly play a role in Simon Spicer's recent UW Ph.D. thesis. (The expert analytic number theorist Andrew Granville helped us out of many confusing thickets.)

In order to use Fourier series we naturally have to rely heavily on Dirac/Schwartz distributions.

SIMUW

University of Washington has a great program called SIMUW: "Summer Institute for Mathematics at Univ of Washington.'' It's for high school; admission is free and based on student merit, not rich parents, thanks to an anonymous wealthy donor!  I taught a SIMUW course one summer from the RH book.  I spent one very intense week on the RH book, and another on the Birch and Swinnerton-Dyer conjecture.

The first part of our book worked well for high school students. For example, we interactively worked with prime races, multiplicative parity, prime counting, etc., using Sage interacts. The students could also prove facts in number theory. They also looked at misleading data and tried to come up with conjectures. In algebraic number theory, usually the first few examples are a pretty good indication of what is true. In analytic number theory, in contrast, looking at the first few million examples is usually deeply misleading.

Reader feedback: "I dare you to find a typo!"

In early 2015, we posted drafts on Google+ daring anybody to find typos. We got massive feedback. I couldn't believe the typos people found. One person would find a subtle issue with half of a bibliography reference in German, and somebody else would find a different subtle mistake in the same reference. Best of all, highly critical and careful non-mathematicians read straight through the book and found a large number of typos and minor issues that were just plain confusing to them, but could be easily clarified.

Now the book is hopefully not riddled with errors. Thanks entirely to the amazingly generous feedback of these readers, when you flip to a random page of our book (go ahead and try), you are now unlikely to see a typo or, what's worse, some corrupted mathematics, e.g., a formula with an undefined symbol.

Designing the cover

Barry and Gretchen Mazur, Will Hearst, and I designed a cover that combined the main elements of the book: title, Riemann, zeta:


Then designers at CUP made our rough design more attractive according their tastes. As non-mathematician designers, they made it look prettier by messing with the Riemann Zeta function...


Publishing with Cambridge University Press

Over years, we talked with people from AMS, Springer-Verlag and Princeton Univ Press about publishing our book. I met CUP editor Kaitlin Leach at the Joint Mathematics Meetings in Baltimore, since the Cambridge University Press (CUP) booth was directly opposite the SageMath booth, which I was running. We decided, due to their enthusiasm, which lasted more than for the few minutes while talking to them (!), past good experience, and general frustration with other publishers, to publish with CUP.


What is was like for us working with CUP

The actual process with CUP has had its ups and downs, and the production process has been frustrating at times, being in some ways not quite professional enough and in other ways extremely professional. Traditional book publication is currently in a state of rapid change. Working with CUP has been unlike my experiences with other publishers.

For example, CUP was extremely diligent putting huge effort into tracking down permissions for every one of the images in our book. And they weren't satisfy with a statement on Wikipedia that "this image is public domain", if the link didn't work. They tracked down alternatives for all images for which they could get permissions (or in some cases have us partly pay for them). This is in sharp contrast to my experience with Springer-Verlag, which spent about one second on images, just making sure I signed a statement that all possible copyright infringement was my fault (not their's).

The CUP copyediting and typesetting appeared to all be outsourced to India, organized by people who seemed far more comfortable with Word than LaTeX. Communication with people that were being contracted out about our book's copyediting was surprisingly difficult, a problem that I haven't experienced before with Springer and AMS. That said, everything seems to have worked out fine so far.

On the other hand, our marketing contact at CUP mysteriously vanished for a long time; evidently, they had left to another job, and CUP was recruiting somebody else to take over. However, now there are new people and they seem extremely passionate!

The Future

I'm particularly excited to see if we can produce an electronic (Kindle) version of the book later in 2016, and eventually a fully interactive complete for-pay SageMathCloud version of the book, which could be a foundation for something much broader with publishers, which addresses the shortcoming of the Kindle format for interactive computational books. Things like electronic versions of books are the sort of things that AMS is frustratingly slow to get their heads around...

Conclusions

  1. Publishing a high quality book is a long and involved process.
  2. Working with CUP has been frustrating at times; however, they have recruited a very strong team this year that addresses most issues.
  3. I hope mathematicians will put more effort into making mathematics accessible to non-mathematicians.
  4. Hopefully, this talk will give provide a more glimpse into the book writing process and encourage others (and also suggest things to think about when choosing a publisher and before signing a book contract!)

Vince Knight: Survival of the fittest: Experimenting with a high performing strategy in other environments

$
0
0

A common misconception about evolution is that “The fittest organisms in a population are those that are strongest, healthiest, fastest, and/or largest.” However, as that link indicates, survival of the fittest is implied at the genetic level: and implies that evolution favours genes that are most able to continue in the next generation for a given environment. In this post, I’m going to take a look at a high performing strategy from the Iterated Prisoner’s dilemma that was obtained through an evolutionary algorithm. I want to see how well it does in other environments.

Background

This is all based on the Python Axelrod package which makes iterated prisoner dilemma research straightforward and really is just taking a look at Martin Jones’s blog post which described the evolutionary analysis performed to get a strategy (EvolvedLookerUp) that is currently winning the overall tournament for the Axelrod library (with 108 strategies):

Results from overall
tournament

The strategy in question is designed to do exactly that and as you can see does it really well (with a substantial gap between it’s median score and the runner up: DoubleCrosser).

There are some things lacking in the analysis I’m going to present (which strategies I’m looking at, number of tournaments etc…) but hopefully the numerical analysis is still interesting. In essence I’m taking a look at the following question:

If a strategy is good in a big environment, how good is it in any given environment?

From an evolutionary point of view this is kind of akin to seeing how good a predator a shark would be in any random (potentially land based) environment…

 Generating the data

Thanks to the Axelrod, library it’s pretty straightforward to quickly experiment with a strategy (or group of strategies) in a random tournament:

importaxelrodasaxl# Import the axelrod librarydefrank(strategies,test_strategies,repetitions=10,processes=None):"""Return the rank of the test_strategy in a tournament with given    strategiess"""forsintest_strategies:strategies.append(s())nbr=len(test_strategies)tournament=axl.Tournament(strategies,repetitions=repetitions,processes=processes)results=tournament.play()returnresults.ranking[-nbr:],results.wins[-nbr:]

This runs a tournament and returns the rankings and wins for the input strategies. For example, let’s see how Cooperator and Defector do in a random tournament with 2 other strategies:

>>>importaxelrodasaxl>>>importrandom>>>random.seed(1)# A random seed>>>strategies=random.sample([s()forsinaxl.strategies],2)>>>strategies# Our 2 random strategies[TrickyDefector,Prober3]

We can then use the above function to see how Cooperator and Defector do:

>>>rank(strategies,[axl.Cooperator(),axl.Defector()])([3,2],[[0,0,0,0,0,0,0,0,0,0],[2,2,2,2,2,2,2,2,2,2]])

We see that cooperator ranks last (getting no wins), and defector just before last (getting 2 wins). This is confirmed by the actual tournament results:

The idea is to reproduce the above for a variety of tournament sizes, repeating random samples for each size and looking at the wins and ranks for the strategies we’re interested in.

This script generates our data:

importaxelrodasaxlimportcsvimportrandomimportcopymax_size=25# Max size of tournaments considered (maximum size of the sample)tournaments=20# Number of tournaments of each size to run (number of samples)repetitions=10# Number of repetitions of each tournament (for a given sample)test_strategies=[axl.EvolvedLookerUp,axl.TitForTat,axl.Cooperator,axl.Defector,axl.DoubleCrosser]strategies=[s()forsinaxl.strategiesifaxl.obey_axelrod(s)andsnotintest_strategies]defrank(strategies,test_strategies=test_strategies,repetitions=10,processes=None):"""Return the rank of the test_strategy in a tournament with given    strategiess"""forsintest_strategies:strategies.append(s())nbr=len(test_strategies)tournament=axl.Tournament(strategies,repetitions=repetitions,processes=processes)results=tournament.play()returnresults.ranking[-nbr:],results.wins[-nbr:]f=open('combined-data','w')csvwrtr=csv.writer(f)f_lookerup=open('data-lookerup.csv','w')csvwrtr_lookerup=csv.writer(f_lookerup)f_titfortat=open('data-titfortat.csv','w')csvwrtr_titfortat=csv.writer(f_titfortat)f_cooperator=open('data-cooperator.csv','w')csvwrtr_cooperator=csv.writer(f_cooperator)f_defector=open('data-defector.csv','w')csvwrtr_defector=csv.writer(f_defector)f_doublcrosser=open('data-doublecrosser.csv','w')csvwrtr_doublcrosser=csv.writer(f_doublcrosser)data=[]ind_data=[[],[],[],[],[]]forsizeinrange(1,max_size+1):row=[size]ind_row=[copy.copy(row)for_inrange(5)]forkinrange(tournaments):s=random.sample(strategies,size)strategy_labels=";".join([str(st)forstins])trnmt_s=copy.copy(s)results=rank(copy.copy(s),test_strategies=test_strategies,repetitions=repetitions)row.append([strategy_labels,results[0]]+results[1])fori,tsinenumerate(test_strategies):trnmt_s=copy.copy(s)results=rank(copy.copy(s),test_strategies=[ts],repetitions=repetitions)ind_row[i].append([strategy_labels,results[0]]+results[1])data.append(row)csvwrtr.writerow(row)csvwrtr_lookerup.writerow(ind_row[0])csvwrtr_titfortat.writerow(ind_row[1])csvwrtr_cooperator.writerow(ind_row[2])csvwrtr_defector.writerow(ind_row[3])csvwrtr_doublcrosser.writerow(ind_row[4])f.close()f_lookerup.close()f_titfortat.close()f_cooperator.close()f_defector.close()f_doublcrosser.close()

The above creates tournaments up to a size of 25 other strategies, with 20 random tournaments for each size, creating six data files:

Analysing the data

I then used this JuPyTer notebook to analyse the data.

Here is what we see for the EvolvedLookerUp strategy:

The line is fitted to the median rank and number of wins (recall for each number of strategies, 20 different sampled tournaments are considered) We see that (as expected) as the number of strategies increases both the median rank and wins increases, but what is of interest is the rate at which that increase happens.

Below is the fitted lines for all the considered strategies:

Here are the fits (and corresponding plots) for the ranks:

  • EvolvedLookerUp: \(y=0.49x-0.10\) plot
  • TitForTat: \(y=0.53-0.45\) plot
  • Cooperator: \(y=0.42x+1.40\) plot
  • Defector: \(y=0.75x-0.33\) plot
  • DoubleCrosser: \(y=0.51x-0.47\) plot

Here are the fits (and corresponding plots) for the wins:

  • EvolvedLookerUp: \(y=0.28x+0.06\) plot
  • TitForTat: \(y=0.00x+0.00\) plot
  • Cooperator: \(y=0.00x+0.00\) plot
  • Defector: \(y=0.89x+0.14\) plot
  • DoubleCrosser: \(y=0.85-0.10\) plot

It seems that the EvolvedLookerUp strategy does continue to do well (with a low coefficient of 0.49) in these random environments. However what’s interesting is that the simple Cooperator strategy also seems to do well (this might indicate that the random samples are creating ‘overly nice’ conditions).

All of the above keeps the 5 strategies considered separated from each, here is the analysis repeated when combining the strategies with the random sample:

Below is the fitted lines for all the considered strategies:

Here are the fits (and corresponding plots) for the ranks:

  • EvolvedLookerUp: \(y=0.42x+2.05\) plot
  • TitForTat: \(y=0.44+1.95\) plot
  • Cooperator: \(y=0.64+0.00\) plot
  • Defector: \(y=0.47x+1.87\) plot
  • DoubleCrosser: \(y=0.63x+1.88\) plot

Here are the fits (and corresponding plots) for the wins:

  • EvolvedLookerUp: \(y=0.28x+0.05\) plot
  • TitForTat: \(y=0.00x+0.00\) plot
  • Cooperator: \(y=0.00x+0.00\) plot
  • Defector: \(y=0.89x+4.14\) plot
  • DoubleCrosser: \(y=0.85+2.87\) plot

Conclusion

It looks like the EvolvedLookerUp strategy continues to perform well in environments that are not the ones it evolved in.

The Axelrod library makes this analysis possible as you can quickly create tournaments from a wide library of strategies. You could also specify the analysis further by considering strategies of a particular type. For example you could sample only from strategies that act deterministically (no random behaviour):

>>>strategies=[s()forsinaxl.strategiesifnots().classifier['stochastic']]

It would probably be worth gathering even more data to be able to make substantial claims about the performances as well as considering other test strategies but ultimately this gives some insight in to the performances of the strategies in other environments.

For fun

The latest release of the library (v0.0.21) includes the ability to draw sparklines that give a visual representation of the interactions between pairs of strategies. If you’re running python 3 you can include emoji so here goes the sparklines for the test strategies considered:

>>>fromitertoolsimportcombinations>>>test_strategies=[axl.EvolvedLookerUp,axl.TitForTat,axl.Cooperator,axl.Defector,axl.DoubleCrosser]>>>matchups=[(match[0](),match[1]())formatchincombinations(test_strategies,2)]>>>formatchupinmatchups:....match=axl.Match(matchup,10)...._=match.play()....print(matchup)....print(match.sparklines(c_symbol=' 😀 ',d_symbol=' 😡 '))...(EvolvedLookerUp,TitForTat)😀😀😀😀😀😀😀😀😀😀😀😀😀😀😀😀😀😀😀😀(EvolvedLookerUp,Cooperator)😀😀😀😀😀😀😀😀😀😀😀😀😀😀😀😀😀😀😀😀(EvolvedLookerUp,Defector)😀😀😡😡😡😡😡😡😡😡😡😡😡😡😡😡😡😡😡😡(EvolvedLookerUp,DoubleCrosser)😀😀😡😡😀😀😀😀😀😀😀😡😡😡😡😡😡😡😡😡(TitForTat,Cooperator)😀😀😀😀😀😀😀😀😀😀😀😀😀😀😀😀😀😀😀😀(TitForTat,Defector)😀😡😡😡😡😡😡😡😡😡😡😡😡😡😡😡😡😡😡😡(TitForTat,DoubleCrosser)😀😀😡😡😡😡😡😡😡😡😀😡😡😡😡😡😡😡😡😡(Cooperator,Defector)😀😀😀😀😀😀😀😀😀😀😡😡😡😡😡😡😡😡😡😡(Cooperator,DoubleCrosser)😀😀😀😀😀😀😀😀😀😀😀😡😡😡😡😡😡😡😡😡(Defector,DoubleCrosser)😡😡😡😡😡😡😡😡😡😡😀😡😡😡😡😡😡😡😡😡

Sébastien Labbé: slabbe-0.2.spkg released

$
0
0

These is a summary of the functionalities present in slabbe-0.2.spkg optional Sage package. It works on version 6.8 of Sage but will work best with sage-6.10 (it is using the new code for cartesian_product merged the the betas of sage-6.10). It contains 7 new modules:

  • finite_word.py
  • language.py
  • lyapunov.py
  • matrix_cocycle.py
  • mult_cont_frac.pyx
  • ranking_scale.py
  • tikz_picture.py

Cheat Sheets

The best way to have a quick look at what can be computed with the optional Sage package slabbe-0.2.spkg is to look at the 3-dimensional Continued Fraction Algorithms Cheat Sheets available on the arXiv since today. It gathers a handful of informations on different 3-dimensional Continued Fraction Algorithms including well-known and old ones (Poincaré, Brun, Selmer, Fully Subtractive) and new ones (Arnoux-Rauzy-Poincaré, Reverse, Cassaigne).

/Files/2015/arp_cheat_sheet.png

Installation

sage -i http://www.slabbe.org/Sage/slabbe-0.2.spkg    # on sage 6.8
sage -p http://www.slabbe.org/Sage/slabbe-0.2.spkg    # on sage 6.9 or beyond

Examples

Computing the orbit of Brun algorithm on some input in \(\mathbb{R}^3_+\) including dual coordinates:

sage:fromslabbe.mult_cont_fracimportBrunsage:algo=Brun()sage:algo.cone_orbit_list((100,87,15),4)[(13.0,87.0,15.0,1.0,2.0,1.0,321),(13.0,72.0,15.0,1.0,2.0,3.0,132),(13.0,57.0,15.0,1.0,2.0,5.0,132),(13.0,42.0,15.0,1.0,2.0,7.0,132)]

Computing the invariant measure:

sage:fig=algo.invariant_measure_wireframe_plot(n_iterations=10^6,ndivs=30)sage:fig.savefig('a.png')
/Files/2015/brun_invm_wireframe_plot.png

Drawing the cylinders:

sage:cocycle=algo.matrix_cocycle()sage:t=cocycle.tikz_n_cylinders(3,scale=3)sage:t.png()
/Files/2015/brun_cylinders_3.png

Computing the Lyapunov exponents of the 3-dimensional Brun algorithm:

sage:fromslabbe.lyapunovimportlyapunov_tablesage:lyapunov_table(algo,n_orbits=30,n_iterations=10^7)30succesfullorbitsminmeanmaxstd+-----------------------+---------+---------+---------+---------+$\theta_1$0.30260.30450.30510.00046$\theta_2$-0.1125-0.1122-0.11150.00020$1-\theta_2/\theta_1$1.36801.36841.36890.00024

Dealing with tikzpictures

Since I create lots of tikzpictures in my code and also because I was unhappy at how the view command of Sage handles them (a tikzpicture is not a math expression to put inside dollar signs), I decided to create a class for tikzpictures. I think this module could be usefull in Sage so I will propose its inclusion soon.

I am using the standalone document class which allows some configurations like the border:

sage:fromslabbeimportTikzPicturesage:g=graphs.PetersenGraph()sage:s=latex(g)sage:t=TikzPicture(s,standalone_configs=["border=4mm"],packages=['tkz-graph'])

The repr method does not print all of the string since it is often very long. Though it shows how many lines are not printed:

sage:t
\documentclass[tikz]{standalone}
\standaloneconfig{border=4mm}
\usepackage{tkz-graph}
\begin{document}
\begin{tikzpicture}%
\useasboundingbox(0,0)rectangle(5.0cm,5.0cm);%
\definecolor{cv0}{rgb}{0.0,0.0,0.0}......68linesnotprinted(3748charactersintotal)......
\Edge[lw=0.1cm,style={color=cv6v8,},](v6)(v8)
\Edge[lw=0.1cm,style={color=cv6v9,},](v6)(v9)
\Edge[lw=0.1cm,style={color=cv7v9,},](v7)(v9)%
\end{tikzpicture}
\end{document}

There is a method to generates a pdf and another for generating a png. Both opens the file in a viewer by default unless view=False:

sage:pathtofile=t.png(density=60,view=False)sage:pathtofile=t.pdf()
/Files/2015/petersen_graph.png

Compare this with the output of view(s, tightpage=True) which does not allow to control the border and also creates a second empty page on some operating system (osx, only one page on ubuntu):

sage:view(s,tightpage=True)
/Files/2015/petersen_graph_view.png

One can also provide the filename where to save the file in which case the file is not open in a viewer:

sage:_=t.pdf('petersen_graph.pdf')

Another example with polyhedron code taken from this Sage thematic tutorial Draw polytopes in LateX using TikZ:

sage:V=[[1,0,1],[1,0,0],[1,1,0],[0,0,-1],[0,1,0],[-1,0,0],[0,1,1],[0,0,1],[0,-1,0]]sage:P=Polyhedron(vertices=V).polar()sage:s=P.projection().tikz([674,108,-731],112)sage:t=TikzPicture(s)sage:t
\documentclass[tikz]{standalone}
\begin{document}
\begin{tikzpicture}%[x={(0.249656cm,-0.577639cm)},y={(0.777700cm,-0.358578cm)},z={(-0.576936cm,-0.733318cm)},scale=2.000000,......80linesnotprinted(4889charactersintotal)......
\node[vertex]at(1.00000,1.00000,-1.00000){};
\node[vertex]at(1.00000,1.00000,1.00000){};%%%%
\end{tikzpicture}
\end{document}sage:_=t.pdf()
/Files/2015/polyhedron.png

Vince Knight: I think this is how to crawl the history of a git repository

$
0
0

This blog post is a direct application of Cunningham’s Law: which is that “the best way to get the right answer on the Internet is not to ask a question, it’s to post the wrong answer”. With the other core developers of the Axelrod library we’re writing a paper and I wanted to see the evolution of a particular property of the library through the 2000+ commits (mainly to include a nice graph in the paper). This post will detail how I’ve cycled through all the commits and recorded the particular property I’m interested in. EDIT: thanks to Mario for the comments: see the edits in bold to see the what I didn’t quite get right.

The Axelrod library is a collaborative project that allows anyone to submit strategies for the iterated prisoner’s dilemma via pull request (read more about this here: axelrod.readthedocs.org/en/latest/). When the library was first put on github it had 6 strategies, it currently has 118. This figure can be obtained by simply running:

>>>importaxelrod>>>len(axelrod.strategies)118

The goal of this post is to obtain the plot below:

The number of strategies over
time


EDIT: here is the correct plot:

The correct number of strategies over
time


Here is how I’ve managed that:

  1. Write a script that imports the library and throws the required data in to a file.
  2. Write another script that goes through the commits and runs the previous script.

So first of all here’s the script that gets the number of strategies:

importaxelrodfromsysimportargvtry:iftype(len(axelrod.strategies))isint:printargv[1],len(axelrod.strategies),argv[2]except:pass

The (very loose) error handling is because any given commit might or might not be able to run at all (for a number of reasons). The command line arguments are so that my second script can pass info about the commits (date and hash).

Here is the script that walks the github repository:

fromgitimportRepo# This imports the necessary class from the gitPython packageimportosimportsubprocessimporttimepath_to_repo="~/src/Axelrod/"repo=Repo(path_to_repo)all_commits=[cforcinrepo.iter_commits()]# Get all the commitsgit=repo.git# This creates an object that I can just use basic git commands withgit.checkout('master')# Make sure I start at mastertime.sleep(10)# Need to give time for files writetry:os.remove('data')# Delete the data file if it already existsexceptOSError:passforcinsorted(all_commits,key=lambdax:x.committed_date):# Go through all commitsforrubbishin[".DS_Store","axelrod/.DS_Store","axelrod/tests/.DS_Store","axelrod/strategies/.DS_Store"]:# Having to delete some files that were not in gitignore at the time of the committry:os.remove(path_to_repo+rubbish)exceptOSError:passgit.checkout(c)# Checkout the committime.sleep(10)# Need to let files writef=open('data',"a")subprocess.call(['python2','number_of_strategies.py',str(c.committed_date),c.hexsha],stdout=f)# Call the other script and output to the `data` filef.close()git.checkout('master')# Go back to HEAD of master

Now, I am not actually sure if I need the 10 seconds of sleep in there but it seems to make things a little more reliable (this is where I’m hoping some knowledgeable kind soul will point out something isn’t quite right).

Here is an animated gif of the library as the script checks through the commits (I used a sleep of 0.1 second here, and cut if off at the beginning):

Walking through a repository

(You can find a video version of the above at the record.it site.)

The data set from above looks like this:

...
1424259748 6 5774fec6b3029b60c6b1bf4cb5d8bfb5323a1ad3
1424259799 6 35db17958a93e66cc09a7e7b865127b8d20acd85
1424261483 6 79c03291a1f0211925755962411d28c932150aaa
1424264425 7 f4be6bcbe9e122eb036a141f48f5acbf03b9290c
1424264540 7 6f28c9f8653e39b496c872351bce5a420e474c17
1424264950 7 456d9d25dbc44e29dde6b39455d10314824479bb
1424264958 7 0c01b14b5c3180d9e4016b09e532410cafd53992
1424265660 7 3eeec928cb7261af797044ac3bde1b26e11a7897
1424266926 7 cf506116005acd5a450894ca67eb0b670d5fd597
1424268080 8 87aa895089cdb105471280a0c374623ee7f6c9ba
1424268969 7 d0c36795fd6a69f9a1558b0b1e738d7633eb1b8e
1424270889 8 d487a97c9327235c4c334b23684583a116cc407a
1424272151 8 e9cd655661d3cef0a6df20cc509ae5ac2431f896
...

That’s all great and then the plot above can be drawn straightforwardly. The thing is: I’m not convinced it’s worked as I had hoped. Indeed: c7dc2d22ff2e300098cd9b29cd03080e01d64879 took place on the 18th of June and added 3 strategies but it’s not in the data set (or indeed in the plot).

Also, for some reason the data set gets these lines at some point (here be gremlins…) ?????:

...
<class 'axelrod.strategies.alternator.Alternator'>
<class 'axelrod.strategies.titfortat.AntiTitForTat'>
<class 'axelrod.strategies.titfortat.Bully'>
<class 'axelrod.strategies.cooperator.Cooperator'>
<class 'axelrod.strategies.cycler.CyclerCCCCCD'>
<class 'axelrod.strategies.cycler.CyclerCCCD'>
<class 'axelrod.strategies.cycler.CyclerCCD'>
<class 'axelrod.strategies.defector.Defector'>
<class 'axelrod.strategies.gobymajority.GoByMajority'>
<class 'axelrod.strategies.titfortat.SuspiciousTitForTat'>
<class 'axelrod.strategies.titfortat.TitForTat'>
<class 'axelrod.strategies.memoryone.WinStayLoseShift'>
...

What’s more confusing is that it’s not completely wrong because that does overall look ‘ok’ (correct number of strategies at the beginning, end and various commits are right there). So does anyone know why the above doesn’t work properly?

I’m really hoping this xkcd comic kicks in and someone tells me what’s wrong with what I’ve done:

Duty Calls http://xkcd.com/386/


EDIT: Big thanks to Mario Wenzel below in the comments for figuring out everythig that wasn’t quite right.

Here’s the script to count the strategies (writing to file instead of piping and also with correct error catching to deal with changes within the library):

fromsysimportargvimportcsvtry:importaxelrodstrategies=[]try:iftype(axelrod.strategies)islist:strategies+=axelrod.strategiesexcept(AttributeError,TypeError):passtry:iftype(axelrod.ordinary_strategies)islist:strategies+=axelrod.ordinary_strategiesexcept(AttributeError,TypeError):passtry:iftype(axelrod.basic_strategies)islist:strategies+=axelrod.basic_strategiesexcept(AttributeError,TypeError):passtry:iftype(axelrod.cheating_strategies)islist:strategies+=axelrod.cheating_strategiesexcept(AttributeError,TypeError):passcount=len(set(strategies))f=open('data','a')csvwrtr=csv.writer(f)csvwrtr.writerow([argv[1],count,argv[2]])f.close()except:pass

Here is the modified script to roll through the commits (basically the same as before but it calls the other script with the -B flag (to avoid importing compiled files) and also without the need to sleep:

fromgitimportRepoimportaxelrodimportosimportsubprocessimporttimeimportcsvpath_to_repo="~/src/Axelrod"repo=Repo(path_to_repo)all_commits=[cforcinrepo.iter_commits()]git=repo.gitnumber_of_strategies=[]dates=[]git.checkout('master')try:os.remove('data')exceptOSError:passforcinsorted(all_commits,key=lambdax:x.committed_date):forrubbishin[".DS_Store","axelrod/.DS_Store","axelrod/tests/.DS_Store","axelrod/strategies/.DS_Store"]:# Having to delete some files that were not in gitignore at the time of the committry:os.remove(path_to_repo+rubbish)exceptOSError:passgit.checkout(c)try:subprocess.call(['python2','-B','number_of_strategies.py',str(c.committed_date),c.hexsha])dates.append(c.committed_date)exceptImportError:passgit.checkout('master')

It looks like you should delete all pyc files from the repository in question and run the second script with the -B tag.

Thanks again Mario!

Vince Knight: The Dilemma of giving Christmas Gifts

$
0
0

This post gives a game theoretic explanation as to why we exchange gifts. On twitter @alexip tweeted “‘Let’s agree not to give each other presents for Christmas’ is just another case of the prisoner’s dilemma #gametheory”. This post builds on that and investigates the premise fully in an evolutionary context investigating different values of how good it feels to give and receive a gift :)

Photo of alex's
tweet

To illustrate this consider the situation where Alex and Camille are approaching Christmas:

Alex: How about we don’t buy Christmas present for each other this year?

Camille: Sounds great.

Let us describe how this situation corresponds to a prisoner’s dilemma.

  • If Alex and Camille cooperate and indeed keep their promise of not getting gifts than let us assume they both get a utility of \(R\) (reward).
  • If Alex cooperates but Camille decides to defect and nonetheless give a gift then Alex will feel a bit bad and Camille will feel good, so Alex gets a utility of \(S\) (sucker) and Camille a utility of \(T\) (temptation).
  • Vice versa if Camille cooperates but Alex decides to give a gift.
  • If both Alex and Camille go against their promise then they both get a utility of \(P\) (punishment).

This looks something like:

PD

If we assume that we feel better when we give gifts and will be keen to ‘cheat’ a promise of not giving then that corresponds to the following inequality of utilities:

In this case we see that if Camille chooses to cooperate then Alex’s best response is to play defect (as \(T>R\)):

If Camille is indeed going to not give a gift, then Alex should give a gift.

Also if Camille chooses to defect then Alex’s best response is to defect once again (as \(P>S\)):

If Camille is going to ‘break the promise’ then Alex should give a gift.

So no matter what happens: Alex should defect.

In game theory this is what is called a dominating strategy, and indeed this situation is referred to as a Prisoner’s Dilemma and is what Alex was referring to in his original tweet.

How does reputation effect gift giving?

So far all we are really modelling is a SINGLE exchange of gifts. If we were to exchange gifts every year we would perhaps learn to trust each other, so that when Camille says they are not going to give a gift Alex has reason to believe that they will indeed not do so.

This is called an iterated Prisoner’s dilemma and has been the subject of a great amount of academic work.

Let us consider two types of behaviour that Camille and Alex could choose to exhibit, they could be:

  • Alternator: give gifts one year and not give gifts the next.
  • TitForTat: do whatever the other does the previous year.

Let us assume that Alex and Camille will be faced with this situation for 10 years. I’m going to use the Python Axelrod library to illustrate things:

>>>importaxelrodasaxl>>>alex,camille=axl.Alternator(),axl.TitForTat()>>>match=axl.Match([alex,camille],10)>>>_=match.play()>>>print(match.sparklines(c_symbol='😀',d_symbol='🎁'))😀🎁😀🎁😀🎁😀🎁😀🎁😀😀🎁😀🎁😀🎁😀🎁😀

We see that Alex and Camille never actually exchange gifts the same year (the 😀 means that the particular player cooperates, the 🎁 that they don’t and give a gift).

Most of the ongoing Iterated Prisoner’s Dilemma research is directly due to a computer tournament run by Robert Axelrod in the 1980s. In that work Axelrod invited a variety of computer strategies to be submitted and they then played against each other. You can read more about that here: axelrod.readthedocs.org/en/latest/reference/description.html but the important thing is that there are a bunch of ‘behaviours’ that have been well studied and that we will look at here:

  1. Cooperator: never give gifts
  2. Defector: always give gifts
  3. Alternator: give gifts one year and not give gifts the next.
  4. TitForTat: do whatever the other does the previous year.
  5. TwoTitForTat: will start by not giving a gift but if the other player gives a gift will give a gift the next two years.
  6. Grudger: start by not giving gifts but if at any time someone else goes against the promise: give a gift no matter what.

What we will now do is see how much utility (how people feel about their gift giving behaviour) if we have a situation where 6 people exchange gifts for 50 years and each person acts according to one of the above behaviours.

For our utility we will use the following values of \(R, P, S, T\):

Here is how we can do this in python:

>>>family=[axl.Cooperator(),...axl.Defector(),...axl.Alternator(),...axl.TitForTat(),...axl.TwoTitsForTat(),...axl.Grudger()]>>>christmas=axl.Tournament(family,turns=50,repetitions=1)>>>results=christmas.play()>>>results.scores[[525],[562],[417],[622],[646],[646]]

We see that the people that do the best are the last two: TwoTitForTat and Grudger. These are people who are quick enough to react to people who won’t keep their promise but that do give hope to people who will!

 At a population level: evolution of gift giving

We can consider this in an evolutionary context where we see how the behaviour is allowed to evolve amongst a whole population of people. This particular type of game theoretic analysis is concerned not in micro interactions but long term macro stability of the system.

Here is how we can see this using Python:

>>>evo=axl.Ecosystem(results)>>>evo.reproduce(100)>>>plot=axl.Plot(results)>>>plot.stackplot(evo)

Basic Christmas
Evolution

What we see is that over time, the population evolves to only Cooperator, TitForTat, Grudger and TwoTitsForTat, but of course in a population with only those strategies everyone is keeping their promise, cooperating and not giving gifts.

Let us see how this changes for different values of \(R, P, S, T\).

To check if not giving presents is evolutionary stable we just need to see what the last population numbers are for the Alternator and Defector. Here is a Python function to do this:

>>>defcheck_if_end_pop_cooperates(r=3,p=1,s=0,t=5,...digits=5,family=family,turns=10000):..."""Returns a boolean and the last population vector"""...game=axl.Game(r=r,p=p,s=s,t=t)...christmas=axl.Tournament(family,turns=50,repetitions=1,game=game)...results=christmas.play()...evo=axl.Ecosystem(results)...evo.reproduce(turns)...last_pop=[round(pop,digits)forpopinevo.population_sizes[-1]]...returnlast_pop[1]==last_pop[2]==0,last_pop

We see that for the default values of \(R, P, S, T\) we have:

>>>check_if_end_pop_cooperates(r=3,p=1,s=0,t=5)(True,[0.16576,0.0,0.0,0.26105,0.28659,0.28659])

As already seen we have that for these values we end up with everyone keeping to the promise. Let us increase the value of \(T\) by a factor of 100:

>>>check_if_end_pop_cooperates(r=3,p=1,s=0,t=500)(False,[0.0,1.0,0.0,0.0,0.0,0.0])

We here see, that if the utility of giving a gift when the receiver is not giving one in return is very large, the overall population will always give a gift:

Increasing t by factor of 100

 Seeing the effect of how good giving gifts makes us feel

The final piece of analysis I will carry out is a parameter sweep of the above:

  • \(5\leq T \leq 100\)
  • \(3\leq R < T\)
  • \(1\leq P < R\)
  • \(0\leq S < P\)

All of this data sweep is in this csv file. Here is the distribution of parameters for which everyone gives a gift (reneging on the promise):

Parameters for kept
promise

Here is the distribution of parameters for which everyone keeps their promise and does not give gifts:

Parameters for kept
promise

We see that people keep their promise if the \(T\) utility (the utility of being tempted to break the promise) is very high compared to all other utilities.

Carrying out a simple logistic regression we see the coefficients of each of the variables as follows:

  • \(P\): 3.007720
  • \(R\): -2.830106
  • \(S\): 0.010675
  • \(T\): -0.107508

The parameters that have a positive effect on keeping the promise is \(R\) and \(S\) which is the reward for the promise being kept and for not giving a gift but receiving one.

TLDR

Agreeing to not give gifts at Christmas can be an evolutionary stable strategy, but this is only in the specific case where the utility of ‘giving’ is less than the utility of ‘not giving’. Given that in practice this promise is almost always broken (that’s my personal experience anyway) this would suggest that people enjoy giving gifts a lot more than receiving them.

Merry christmas 🎄🎁⛄️.


William Stein: Mathematics Graduate School: preparation for non-academic employment

$
0
0
This is about my personal experience as a mathematics professor whose students all have non-academic jobs that they love. This is in preparation for a panel at the Joint Mathematics Meetings in Seattle.

My students and industry
My graduated Ph.D. students:
  • 3 at Google
  • 1 at Facebook
  • 1 at CCR
My graduating student (Hao Chen):
  • Applying for many postdocs
  • But just did summer internship at Microsoft Research with Kristin. (I’ve had four students do summer internships with Kristin)
All my students:
  • Have done a lot of Software development, maybe having little to do with math, e.g., “developing the Cython compiler”, “transition the entire Sage project to git”, etc.
  • Did a thesis squarely in number theory, with significant theoretical content.
  • Guilt (or guilty pleasure?) spending time on some programming tasks instead of doing what they are “supposed” to do as math grad students.

Me: academia and industry

  • Math Ph.D. from Berkeley in 2000; many students of my advisor (Lenstra) went to work at CCR after graduating…
  • Academia: I’m a tenured math professor (since 2005) – number theory.
  • Industry: I founded a Delaware C Corp (SageMath, Inc.) one year ago to “commercialize Sage” due to VERY intense frustration trying to get grant funding for Sage development. Things have got so bad, with so many painful stupid missed opportunities over so many years, that I’ve given up on academia as a place to build Sage.
Reality check: Academia values basic research, not products. Industry builds concrete valuable products. Not understanding this is a recipe for pain (at least it has been for me).

Advice for students from students

Robert Miller (Google)

My student Robert Miller’s post on Facebook yesterday: “I LOVE MY JOB”. Why: “Today I gave the first talk in a seminar I organized to discuss this result: ‘Graph Isomorphism in Quasipolynomial Time’. Dozens of people showed up, it was awesome!”
Background: When he was my number theory student, working on elliptic curves, he gave a talk about graph theory in Sage at a Sage Days (at IPAM). His interest there was mainly in helping an undergrad (Emily Kirkman) with a Sage dev project I hired her to work on. David Harvey asked: “what’s so hard about implementing graph isomorphism”, and Robert wanted to find out, so he spent months doing a full implementation of Brendan McKay’s algorithm (the only other one). This had absolutely nothing to do with his Ph.D. thesis work on the Birch and Swinnerton-Dyer conjecture, but I was very supportive.

Craig Citro (Google)

Craig Citro did a Ph.D. in number theory (with Hida), but also worked on Sage aLOT as a grad student and postdoc. He’s done a lot of hiring at Google. He says: “My main piece of advice to potential google applicants is ‘start writing as much code as you can, right now.’ Find out whether you’d actually enjoyworking for a company like Google, where a large chunk of your job may be coding in front of a screen. I’ve had several friends from math discover (the hard way) that they don’t really enjoy full-time programming (any more than they enjoy full-time teaching?).”
“Start throwing things on github now. Potential interviewers are going to check out your github profile; having some cool stuff at the top is great, but seeing a regular stream of commits is also a useful signal.”

Robert Bradshaw (Google)

“A lot of mathematicians are good at (and enjoy) programming. Many of them aren’t (and don’t). Find out. Being involved in Sage is significantly more than just having taken a suite of programming courses or hacking personal scripts on your own: code reviews, managing bugs, testing, large-scale design, working with others’ code, seeing projects through to completion, and collaborating with others, local and remote, on large, technical projects are all important. It demonstrates your passion.”

Rado Kirov (Google)

Robert Bradshaw said it before me, but I have to repeat. Large scale software development requires exposure to a lot of tooling and process beyond just writing code - version control, code reviews, bug tracking, code maintenance, release process, coordinating with collaborators. Contributing to an active open-source project with a large number of contributors like Sage, is a great way to experience all that and see if you would like to make it your profession. A lot of mathematicians write clever code for their research, but if less than 10 people see it and use it, it is not a realistic representation of what working as a software engineer feels like. 

The software industry is in large demand of developers and hiring straight from academia is very common. Before I got hired by Google, the only software development experience on my resume was the Sage graph editor. Along with solid understanding of algorithms and data structures that was enough to get in."

David Moulton (Google)

“Google hires mathematicians now as quantitative analysts = data engineers. Google is very flexible for a tech company about the backgrounds of its employees. We have a long-standing reading group on category theory, and we’re about to start one on Babai’s recent quasi- polynomial-time algorithm for graph isomorphism. And we have a math discussion group with lots of interesting math on it.”

My advice for math professors

Obviously, encourage your students to get involved in open source projects like Sage, even if it appears to be a waste of time or distraction from their thesis work (this will likely feel very counterintuitive you’ll hate it).
At Univ of Washington, a few years ago I taught a graduate-level course on Sage development. The department then refused to run it again as a grad course, which was frankly very frustrating to me. This is exactly the wrong thing to do if you want to increase the options of your Ph.D. students for industry jobs. Maybe quit trying to train our students to be only math professors, and instead give them a much wider range of options.

William Stein: Thinking of using SageMathCloud in a college course?

$
0
0

SageMathCloud course subscriptions

"We are  college instructors of the calculus sequence and ODE’s.  If the college were to purchase one of the upgrades for us as we use Sage with our students, who gets the benefits of the upgrade?  Is is the individual students that are in an instructor’s Sage classroom or is it the  collaborators on an instructor’s project?"

If you were to purchase just the $7/month plan and apply the upgrades to *one* single project, then all collaborators on that one project would benefit from those upgrades while using that project.

If you were to purchase a course plan for say $399/semester, then you could apply the upgrades (network access and members only hosting) to 70 projects that you might create for a course.   When you create a course by clicking +New, then "Manage a Course", then add students, each student has their own project created automatically.  All instructors (anybody who is a collaborator on the project where you clicked "Manage a course") is also added to the student's project. In course settings you can easily apply the upgrades you purchase to all projects in the course.  

Also I'm currently working on a new feature where instructors may choose to require all students in their course to pay for the upgrade themselves.  There's a one time $9/course fee paid by the student and that's it.  At some colleges (in some places) this is ideal, and at other places it's not an option at all.   I anticipate releasing this very soon.


Getting started with SageMathCloud courses


You can fully use the SMC course functionality without paying anything in order to get familiar with it and test it out.  The main benefit of paying is that you get network access and all projects get moved to members only servers, which are much more robust; also, we greatly prioritize support for paying customers.   

This blog post is an overview of using SMC courses:

  http://www.beezers.org/blog/bb/2015/09/grading-in-sagemathcloud/

This has some screenshots and the second half is about courses:

  http://blog.ouseful.info/2015/11/24/course-management-and-collaborative-jupyter-notebooks-via-sagemathcloud/

Here are some video tutorials made by an instructor that used SMC with a large class in Iceland recently:

  https://www.youtube.com/watch?v=dgTi11ZS3fQ
  https://www.youtube.com/watch?v=nkSdOVE2W0A
  https://www.youtube.com/watch?v=0qrhZQ4rjjg

Note that the above videos show the basics of courses, then talk specifically about automated grading of Jupyter notebooks.  That might not be at all what you want to do -- many math courses use Sage worksheets, and probably don't automate the grading yet.

Regarding using Sage itself for teaching your courses, check out the free pdf book to "Sage for Undergraduates" here, which the American Mathematical Society just published (there is also a very nice print version for about $23):

   http://www.gregorybard.com/SAGE.html

Vince Knight: University of Namibia Mathematics Summer School

$
0
0

I am writing this post just after two extraordinary weeks in Namibia. This is a quick personal reflection of what has been an awesome experience. As part of Cardiff University’s Phoenix Project, Martin Mugochi, Rob Wilson and I with Cardiff PhD students Geraint Palmer and Alex MacKay worked with the University of Namibia’s faculty of Mathematics to deliver a two week summer school.

The goal of this joint effort with the University of Namibia was to provide a positive experience of mathematics. As Rob said:

We want them to concentrate on what they can do rather than what they cannot do.

The first week involved inquiry based sessions on both mathematical topics (such as Algebra and Geometry) as well as wider skills (such as presenting and reading mathematics).

This side of the course mainly involved students working on through activities and presenting them to the class which lead to discussion (and in an IBL way ultimately confirmation/verification of the conclusions). This is the point at which we (I’m sure Rob, Alex and Geraint would agree) must say that the students were awesome. Eager to learn, open to the novel pedagogic ideas, a real pleasure to work with.

Here are some photos of the first week (the only local ones as I write this are from the group Alex and I took but things were pretty much the same in Rob and Geraint’s group):

Working on activities

Presenting solutions

Fun

The second week had students work in groups on a variety of projects such as:

  • Mathematical paradoxes,
  • Patterns in Pascal’s triangle,
  • History of mathematics

From the intensity of the first week, this lead to a stark contrast in which students came to us for support. This lead to us not being in direct contact with all the students all the time.

The culmination of the whole school was a 2 hour closing ceremony in which students presented their posters. As we hadn’t seen all the groups we were slightly worried that this might fall flat on it’s face but we were very wrong and it was such a delight to see each and every group turn up to put their awesome poster on the wall.

Here are some of the posters:

Approximations of pi

Patterns in Pascals triangle

Without any nudge on our part students starting walking around and learning from each other’s poster (I am still smiling about this now). This was followed by students giving 5 minute presentations, closing remarks from various UNAM officials, Martin Mugochi (head of the mathematics department) and ourselves.

One of my most pleasant memories (of which there are too many to mention) is what happened just after that though, we (students and us) came together to thank each other for our efforts and get photos:

The inaugural UNAM mathematics summer school

A small group photo

Student selfie with me

Student selfie

This was such a great experience, it was fantastic to work and become good friends with Martin, get to know the students (seeing the benefits of active pedagogic methodologies) and spend two great weeks with Geraint, Alex and Rob:

Geraint, Alex, Rob and I

This is just one of many Phoenix project projects and it’s great to be involved.

Now I need to put this laptop down, get a good night’s sleep and spend tomorrow working on final details for PyCon Namibia.

Viewing all 414 articles
Browse latest View live